
Continuous watchfulness is necessary to ensure seamless functioning in the complicated environment of IT infrastructure. Logging and system monitoring are essential procedures that let you find possible problems, diagnose difficulties, and make sure your systems are functioning properly overall. We will explore in this blog article how these procedures might be made more efficient by utilizing Elasticsearch, a powerful search and analytics engine.
Understanding System Monitoring
System monitoring entails regularly monitoring various components of your IT infrastructure, such as servers, networks, applications, and services. It provides real-time visibility into these components’ health and performance, allowing you to detect bottlenecks, irregularities, and potential breakdowns before they become serious issues.
Factors to be Taken into Account:
- Monitor resource utilization: Keep track of CPU, memory, disk, and network activity to ensure peak performance and identify resource limitations.
- Monitor application performance: Use response times, transaction rates, and error rates to analyze the health and functionality of essential applications.
- Monitor infrastructure availability: Ensure that servers, networks, and services are available and operational at all times.
- Detect security threats. Detect suspicious activity, illegal access attempts, and potential security flaws to avoid data breaches and system compromise.
The Role Of Logs
Logs are a gold mine of details about your systems. Log files normally contain records of all actions, errors, and events. It is possible to gain insight into user behaviour, debugging, forensic investigation, and troubleshooting through the analysis of these logs.
Aggregating and analyzing logs from various sources, such as servers, apps, and network devices, businesses can:
- Troubleshooting: Find error messages or abnormalities quickly and correlate events across several systems to determine the core causes of issues.
- System activity auditing involves keeping tabs on user activities, configuration modifications, and system events to make sure internal and regulatory regulations are being followed.
- Track performance trends: Examine past log data to spot patterns in performance, project capacity requirements, and make the best use of available resources.
- Investigate security incidents: Analyze log data for suspicious activity and trends to detect security breaches, malware infections, and unauthorized access attempts.
Elasticsearch To The Rescue
Elasticsearch comes into play as the central repository for your system monitoring and log data. Its strengths make it an ideal choice for this purpose:
- Scalability: Handles massive volumes of data efficiently, allowing you to scale your monitoring solution as your infrastructure grows.
- Flexibility: Accommodates a wide variety of data formats, including system logs, application logs, and performance metrics.
- Powerful Search: Enables efficient querying and analysis of your log data, helping you quickly find the information you need.
- Visualization with Kibana: Integrates seamlessly with Kibana, a visualization platform that allows you to create insightful dashboards and reports for your monitoring data.
Building Your Monitoring Pipeline
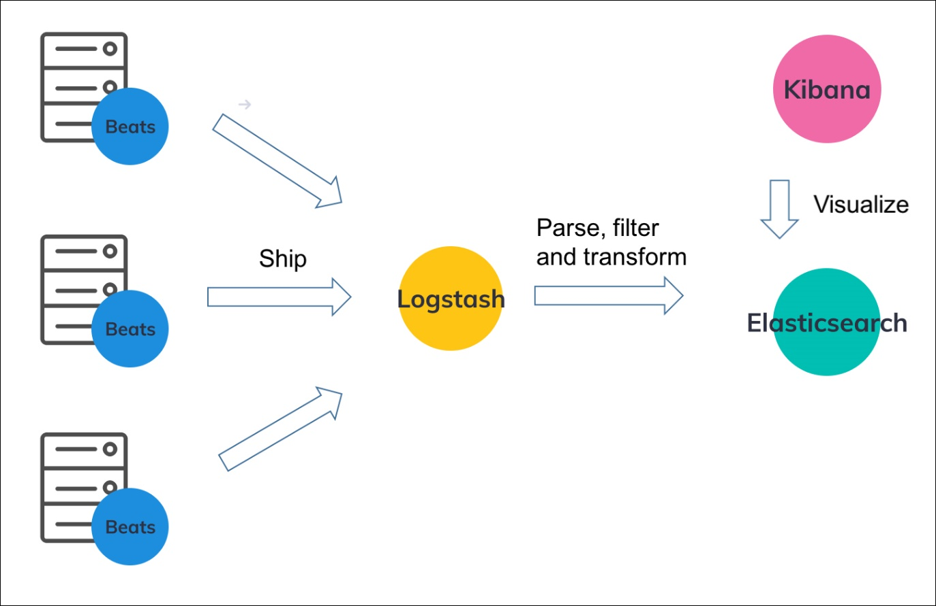
Here’s a simplified overview of how system monitoring and logging with Elasticsearch can be implemented:
- Data Collection: Deploy lightweight agents like Filebeat or Metricbeat on your systems to collect logs and performance metrics.
- Data Indexing: These agents ship the collected data to Elasticsearch via Logstash, where it’s stored in a structured format for efficient querying.
- Analysis and Visualization: Leverage Kibana to create dashboards and visualizations that provide real-time insights into system health, identify trends, and track key performance indicators (KPIs).
Benefits Of Using Elasticsearch
- Centralized Logging: Gain a unified view of logs from all your systems in a single location.
- Improved Troubleshooting: Efficiently search and analyze logs to pinpoint the root cause of issues.
- Real-time Monitoring: Monitor system health and identify problems as they occur.
- Scalability and Flexibility: Adapts to your growing needs and handles diverse data formats.
- Advanced Analytics: Utilize Elasticsearch’s powerful search capabilities to uncover valuable insights from your log data.
Conclusion
Finally, system monitoring, logs, and Elasticsearch are critical components in assuring the stability, performance, and security of modern IT architecture. By properly exploiting these technologies, companies can proactively identify and address issues, optimize system performance, and improve overall system reliability. Whether you manage a small business network or a large-scale enterprise environment, investing in reliable monitoring and log management solutions is critical for remaining current in today’s dynamic digital landscape.


